High-emission flares, responsible for 80% of regional emissions, increase average emission factors to be 2-3 times higher than some EPA estimates
Natural gas flaring, or burning, is commonly used in parts of the United States to dispose of the gas byproduct from oil extraction. The flare’s combustion converts hydrocarbons to carbon dioxide and water, which lessens the climate impact and reduces the safety concerns of the natural gas onsite, but also produces nitrogen oxides, or NOx.
NOx—which includes the highly reactive gases nitric oxide and nitrogen dioxide—directly and indirectly impacts air quality. The Clean Air Act requires the U.S. Environmental Protection Agency (EPA) to regulate nitrogen dioxide, the most prevalent form of NOx, due to its influence on public health and the environment.
Currently, the EPA gauges NOx emissions from flares using emission factors, a static value multiplied by activity data provided by the flare operator. Despite the spread of flaring practices across the U.S., few assessments have directly measured how much NOx flaring operations truly produce.
As a part of the F3UEL project, which aims to provide data-driven updates to U.S. oil and gas emission estimates, a University of Michigan-led research team measured NOx production from real-world natural gas flares.
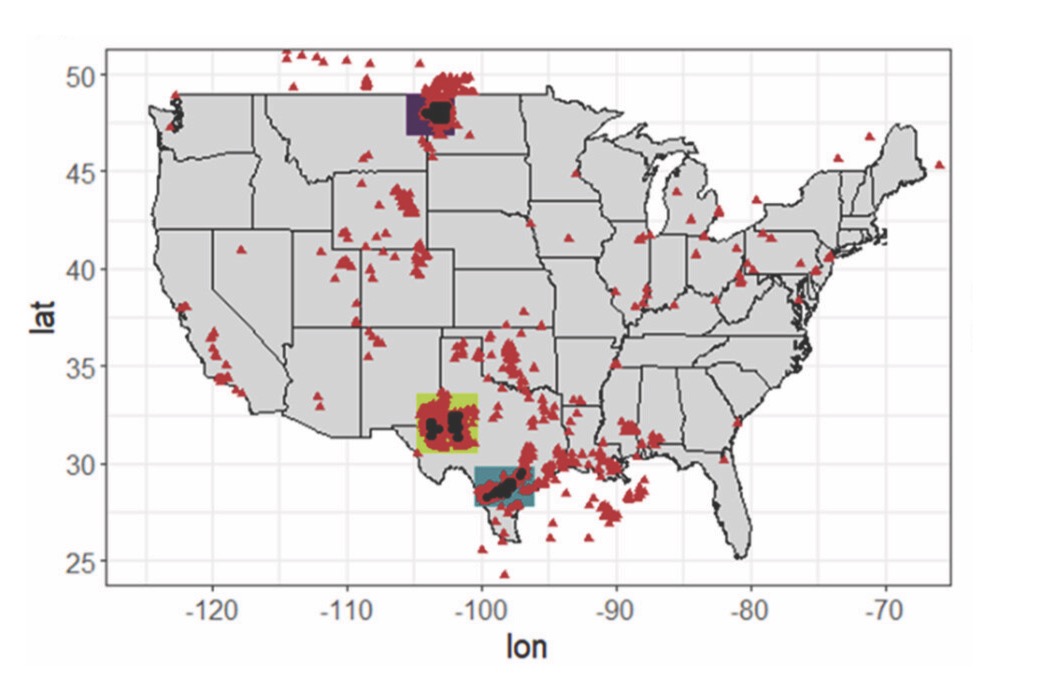
The research team collected data from three regions—Eagle Ford in Texas, Permian in Texas and New Mexico, and Bakken in North Dakota—which together produce more than 80% of gas volumes flared in the U.S.
A small aircraft equipped with high precision instruments flew close to the ground in these regions, intercepting the mixed combustion plume from flares. NOx flaring emissions were estimated for each region using observationally-derived emission factors from 480 airborne intercepts along with region-based estimates of flaring gas volumes.
“Using an airborne approach allowed us to sample flares over large geographical areas and capture a variety of operations conditions, all without requiring ground access to the sites,” said co-author Genevieve Plant, an assistant research scientist of climate and space sciences engineering at the University of Michigan.
“This highlights the importance of measuring emission sources under real-world operating conditions,” said Plant
Although the median emission factor for each region was within the range of values used by the regulatory agency in Texas, some flares generated NOx at much higher rates with 20-30% of the flares responsible for 80% of basin-wide flaring NOx emissions. High-emission flares brought up the average emissions factors in the Bakken and Permian region to two to three times larger than the value used by the EPA.
“Our measurements show that some flares emit excessive amounts of NOx, and that these flares will have greater air quality impact than currently understood,” said co-author Eric A. Kort, an associate professor of climate and space sciences engineering at the University of Michigan.
Reduced air quality could impact the health of workers onsite along with the estimated 17.6 million Americans that live within a mile of active oil and gas wells. For the regions observed in this study, 500,000 people live within 5 kilometers of a flare—a distance associated with an increased risk of preterm birth.
“This work, combined with previous results from the F3UEL project on methane emissions from flares, shows that reducing the volume of gas flared will have greater climate and air quality benefits than previously realized,” added Kort.
Co-authors: Alan M. Gorchov Negron and Graham Fordice of the University of Michigan; Yuanlei Chen of Stanford University; Colin Harkins of the NOAA Chemical Sciences Laboratory and the Cooperative Institute for Research in Environmental Science at the University of Colorado Boulder.
This work was part of the F3UEL Project funded by the Alfred P. Sloan Foundation.
Full citation: “In situ sampling of NOx emissions from United States natural gas flares reveals heavy-tail emission characteristic,” Genevieve Plant, Eric A. Kort, Alan M. Gorchov Negron, Yuanlei Chen, Graham Fordice, and Colin Harkins, Environmental Science & Technology (2024). DOI: 10.1021/acs.est.3c08095
Red triangles represent flaring locations as seen by NOAA’s Visible Infrared Imaging Radiometer Suite (VIIRS). The shaded boxes indicate the oil-producing regions studied with Bakken in purple, Permian in yellow and Eagle Ford in green. Credit: Plant et al. 2024