The Earth’s Changing, Irregular Magnetic Field Causes Headaches for Polar Navigation
Fluctuations in the strength of Earth’s magnetic field can impact the use of geomagnetic field models which are essential for navigation in satellites, planes, ships and cars.
Differences in magnetic field models are also driven by modeling errors, not geophysical phenomena alone
The Earth’s liquid molten outer core, composed mostly of iron and nickel, exerts an electromagnetic field extending from the north and south pole that protects the planet from harmful solar particle radiation.
Fluctuations in the strength of Earth’s magnetic field—caused by daily changes in solar wind structure and intermittent solar storms—can impact the use of geomagnetic field models which are essential for navigation in satellites, planes, ships and cars.
Magnetic field models differ based on the location of data collection—either on or near the Earth’s surface or low Earth orbiting satellites. Past research has attributed model differences to space weather activity levels, but a recent analysis of six years of Earth and satellite magnetic field models found model discrepancies are also driven by modeling errors rather than geophysical phenomena alone. The results are published in the Journal of Geophysical Research: Space Physics.
The University of Michigan research team assessed differences between observations from the Swarm mission’s low-Earth orbit satellites and a Earth magnetic field model, the thirteenth generation of the International Geomagnetic Reference Field or IGRF-13. They focused on differences during low to moderate geomagnetic conditions which encompasses 98.1% of the time between the years 2014 and 2020.
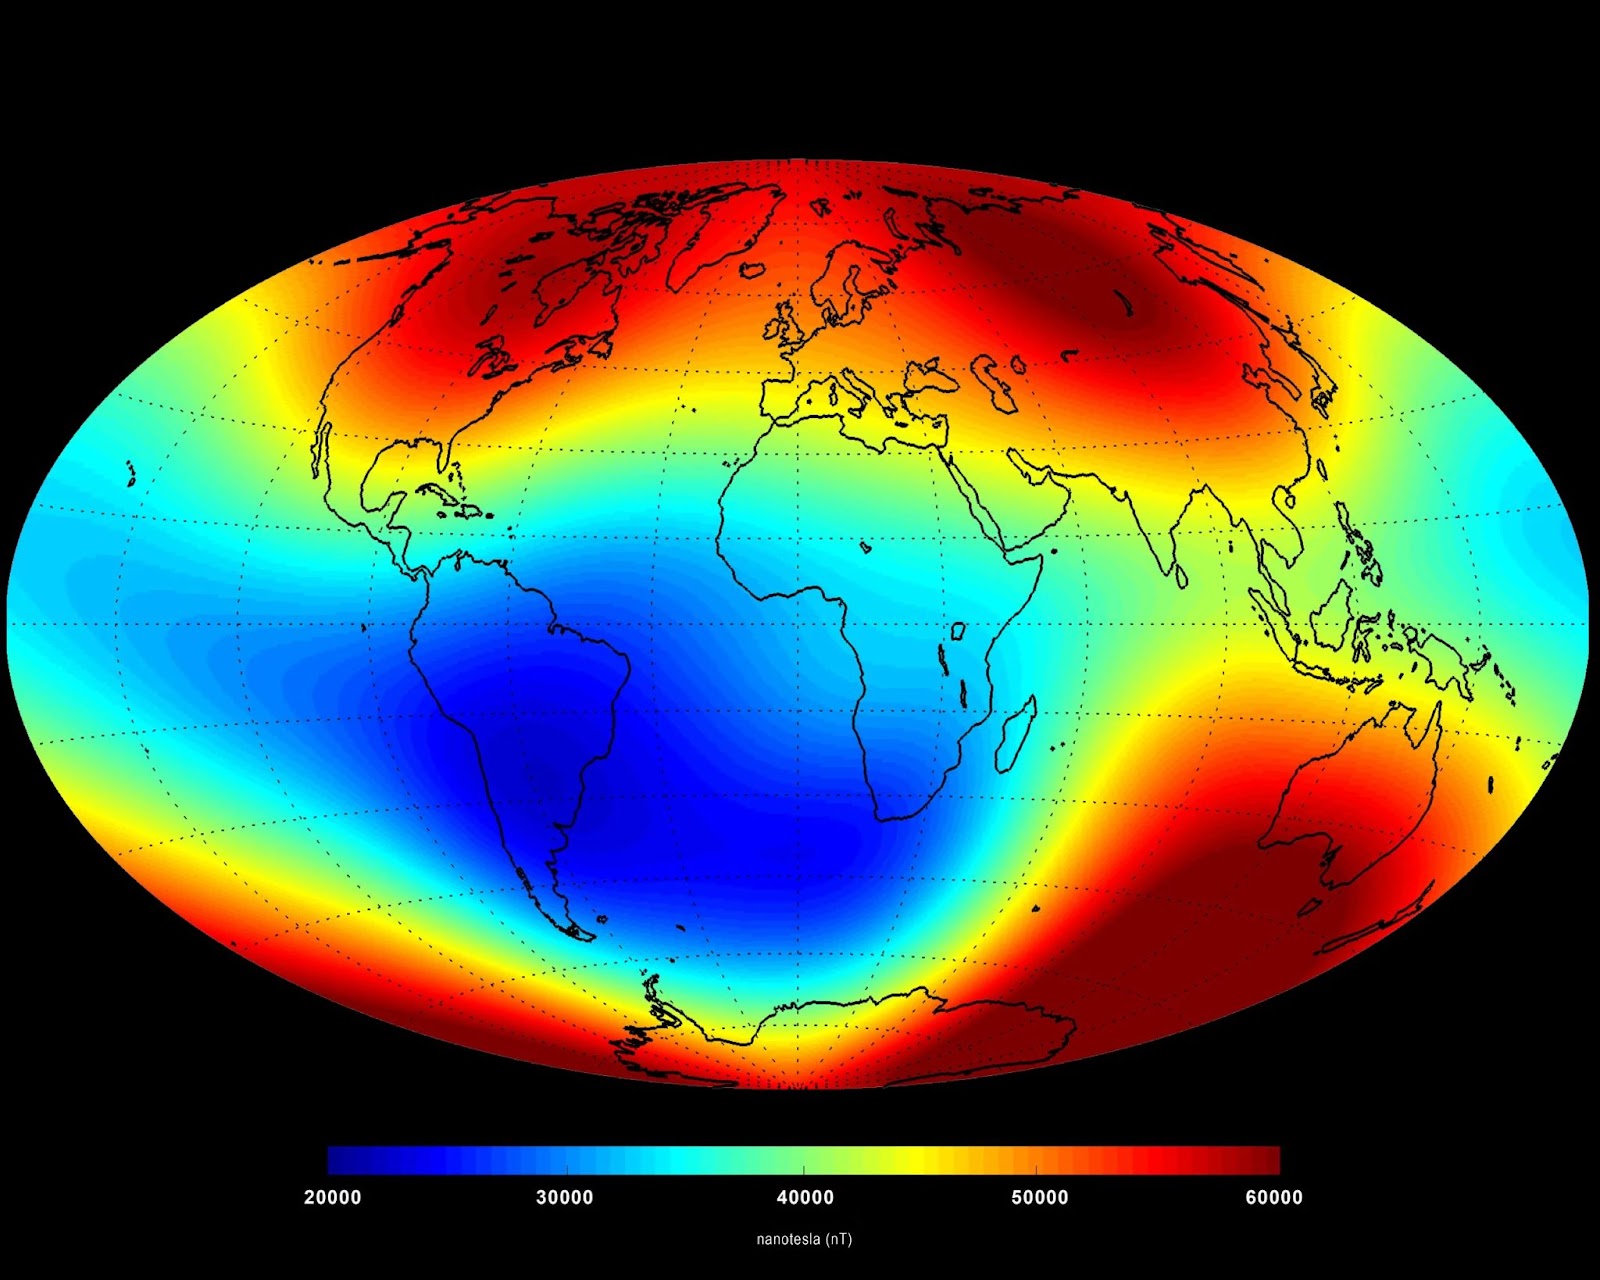
The average strength of the Earth’s magnetic field over six months in 2014 as measured by the European Space Agency’s three-satellite Swarm constellation. Cool colors indicate a weaker magnetic field while warm colors indicate a stronger magnetic field. Credit: European Space Agency/Technical University of Denmark (ESA/DTU Space).
Satellite observations collected at different locations above Earth are sensitive to magnetic field fluctuations, whereas Earth magnetic field models use observations to estimate the Earth’s internal magnetic field without accounting for the influence of solar storms. Internal magnetic field models like IGRF-13 are used to track changes in the Earth’s magnetic poles, like the North pole’s shift of about 45 km north-northwest each year.
Understanding these large differences are important for satellite operation when using IGRF-13 as a reference and for research on the physics of the Earth’s magnetosphere, ionosphere and thermosphere.
Model uncertainty was highest in the north and south polar regions, and a statistical analysis revealed that the asymmetry between the north and south polar regions was a major factor driving model differences.
“We often assume a nearly symmetrical magnetic field between the northern and southern polar regions, but they are actually very different,” said Yining Shi, an assistant research scientist at the University of Michigan Climate and Space Science and Engineering and corresponding author on the study.
The two geographic poles map to different geomagnetic coordinates. The North pole maps to around 84° Magnetic Latitude (MLAT) and 169° Magnetic Longitude (MLON) and the South pole maps to around −74° MLAT and 19° MLON.
The Swarm satellites’ polar orbit track creates a sampling bias with a high concentration of measurements around the geographic poles, which exacerbates the model differences.
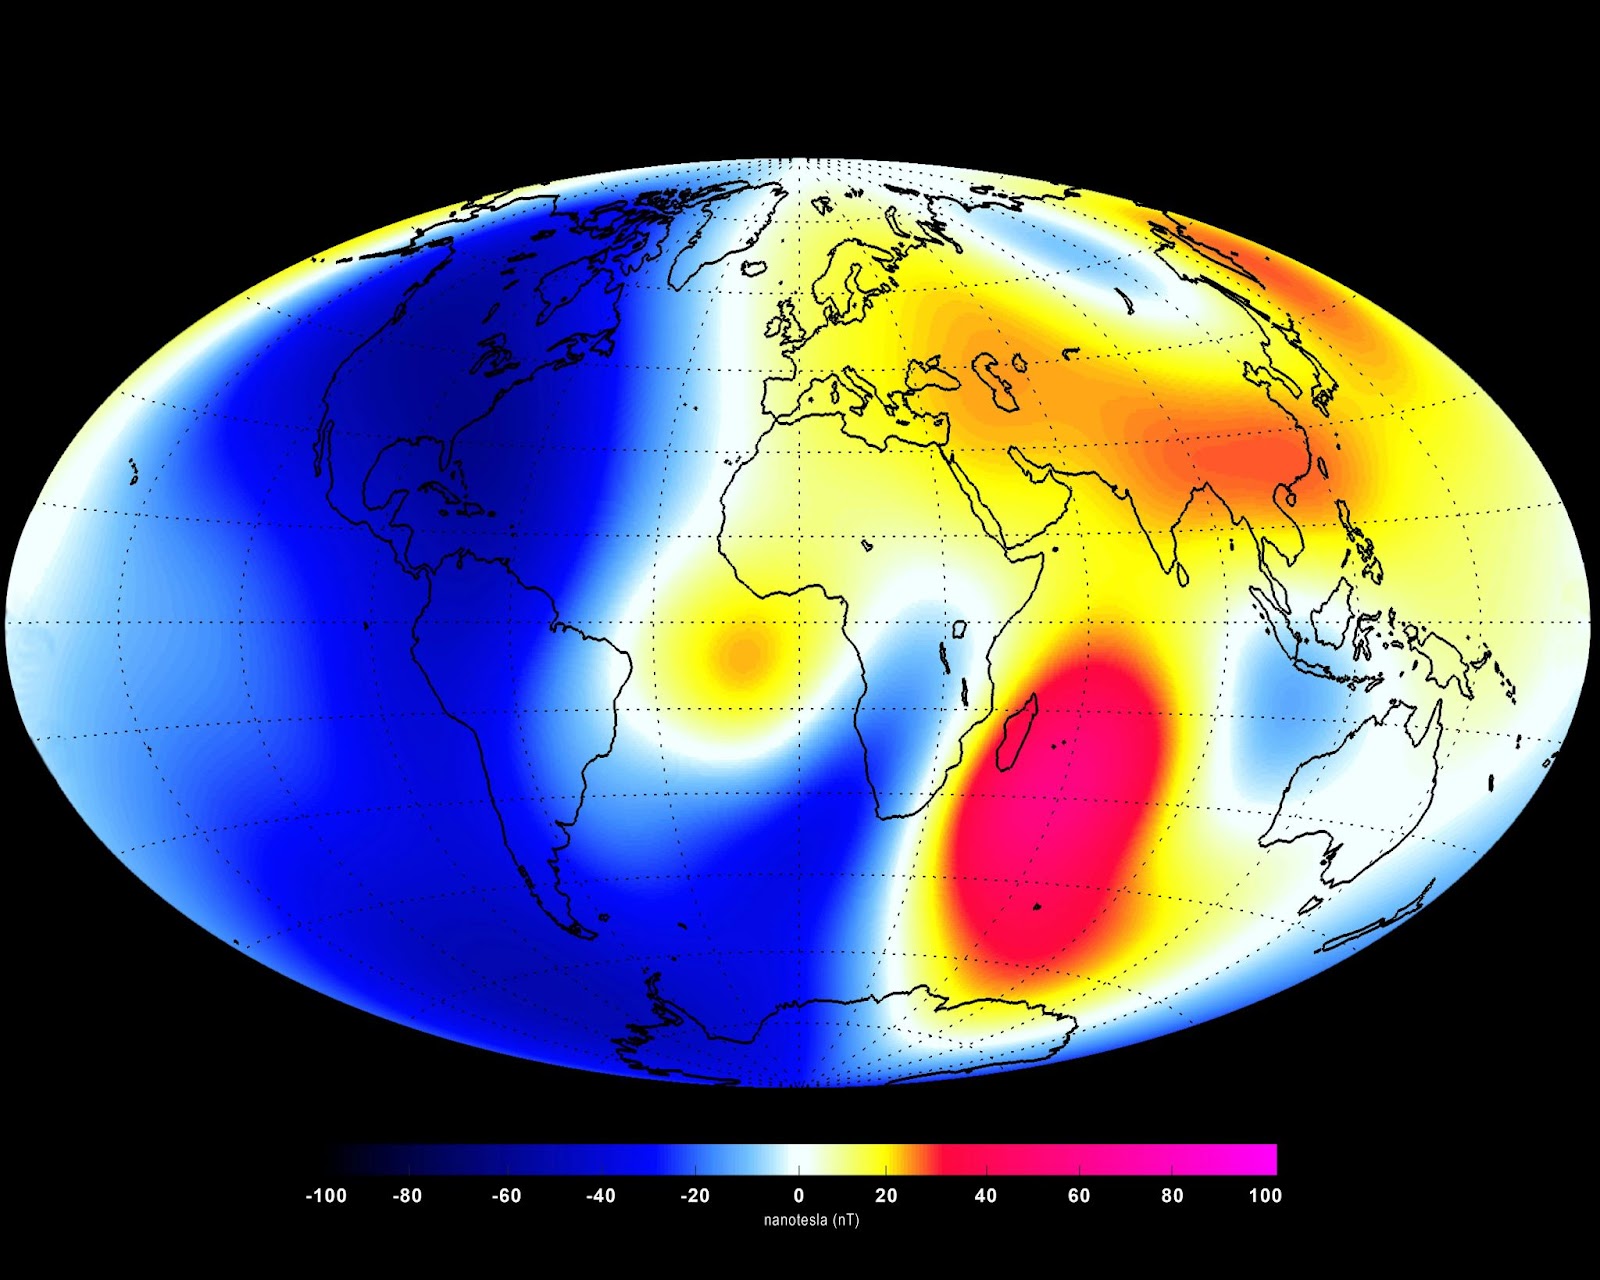
Changes in the strength of the Earth’s magnetic field over the same six months in 2014 as measured by the European Space Agency’s three-satellite Swarm constellation. Cool colors indicate areas where the magnetic field weakened and warm colors indicate where the magnetic field strengthened. European Space Agency/Technical University of Denmark (ESA/DTU Space).
“Understanding that what has been attributed to geophysical disturbances is really due to the asymmetry of the Earth’s magnetic field will help us better create geomagnetic field models as well as help with satellite and aviation navigation,” said Mark Moldwin, an Arthur F Thurnau Professor of Climate and Space Sciences and Engineering at U-M and an author on the study.
Another issue that is causing the navigation community concern, is that the polar magnetic field has been changing rapidly over the past decade or so.
“This adds further complexity to creating accurate magnetic field models,” said Moldwin.
Full citation: “Non-geophysical interhemispheric asymmetries in large magnetic field residuals between swarm observations and earth magnetic field models during moderate to quiet geomagnetic conditions,” Yining Shi and Mark B. Moldwin, Journal of Geophysical Research: Space Physics (2024). DOI: 10.1029/2023JA032092